Clinicians, radiologists, and non-radiologists should approach brain MRI for suspected neurodegenerative disease in a structured, stepwise manner.
First, exclude treatable causes of cognitive decline such as subdural hematoma, brain tumors, or normal pressure hydrocephalus.
Next, screen for hallmark atrophy patterns or lesions associated with common dementias. Examples include:
- Medial temporal lobe atrophy (MTA) and parietal atrophy - suggestive of Alzheimer's disease.
- Frontal and anterior temporal lobe atrophy - suggestive of frontotemporal dementia.
- Extensive white matter lesions or strategic infarcts - suggestive of vascular cognitive impairment.
- Dementia with Lewy bodies - often no specific MRI abnormality, with relatively preserved hippocampi.
After these initial impressions, a more quantitative or systematic assessment is recommended.
Visual Rating Scales
- Global Cortical Atrophy (GCA) scale - overall cortical volume loss (best seen on FLAIR):
- 0 = none, 1 = mild sulcal widening, 2 = moderate gyral volume loss, 3 = severe knife-blade atrophy.
- Medial Temporal Atrophy (MTA) scale - hippocampal and entorhinal cortex atrophy on coronal T1 at the level of the anterior pons:
- 0 = none to 4 = severe.
- Abnormal if >= 2 under age 75, or >= 3 over age 75. Highly sensitive for Alzheimer's disease and rare in normal aging.
- Koedam score - rates parietal-precuneus atrophy. Useful for early-onset or atypical Alzheimer's disease such as posterior cortical atrophy syndrome.
- Fazekas scale - grades chronic small vessel ischemic change on T2/FLAIR:
- 0 = none, 1 = punctate foci, 2 = early confluence, 3 = large confluent areas.
- Scores of 2-3 indicate significant small vessel disease, though mild changes are common in the elderly.
- Strategic infarcts - check for old infarcts in eloquent locations (e.g., bilateral thalamus, dominant hippocampus, anterior cerebral artery territory). Even small lesions in the medial thalamus or posterior cerebral artery territory can precipitate dementia.
Structured Workflow
Interpreting brain MRI in the context of suspected neurodegenerative disease requires a structured, step-by-step method to ensure no important finding is missed. This approach is useful for radiologists, neurologists, and non-radiology clinicians alike.
Step 1 - Exclude Treatable Causes
Before attributing changes to a degenerative process, always rule out potentially reversible causes of cognitive decline. Common examples include:
- Subdural hematoma - particularly chronic collections in elderly or anticoagulated patients.
- Intracranial tumors - meningioma, glioma, or metastases may present with progressive cognitive symptoms.
- Normal pressure hydrocephalus (NPH) - look for enlarged ventricles out of proportion to cortical atrophy, with a compatible clinical triad of gait disturbance, urinary incontinence, and cognitive decline.
Identifying and addressing these conditions early can prevent unnecessary diagnostic delay.
Step 2 - Screen for Hallmark Atrophy Patterns and Lesions
After excluding treatable causes, perform a rapid screen for patterns commonly associated with the major dementia syndromes:
- Alzheimer's disease (AD) - medial temporal lobe atrophy (MTA) plus posterior parietal atrophy.
- Frontotemporal dementia (FTD) - frontal and anterior temporal atrophy.
- Vascular cognitive impairment - confluent white matter hyperintensities, lacunes, or strategic infarcts.
- Dementia with Lewy bodies (DLB) - often structurally normal hippocampi and no marked regional atrophy.
This pattern recognition provides an initial working hypothesis before moving to formal scoring.
Step 3 - Apply Standardized Visual Rating Scales
- Global Cortical Atrophy (GCA)
- Assesses overall cortical volume loss, best viewed on axial or coronal FLAIR images.
Scale:- 0 = no atrophy
- 1 = mild sulcal widening
- 2 = moderate gyral thinning
- 3 = severe "knife-blade" gyri
- Assesses overall cortical volume loss, best viewed on axial or coronal FLAIR images.
- Medial Temporal Atrophy (MTA)
- Evaluates hippocampal and entorhinal cortex volume on coronal T1 images at the level of the anterior pons.
Scale:- 0 = none
- 1-2 = mild to moderate
- 3-4 = severe
- Abnormal if >= 2 in patients under 75 years old
- Abnormal if >= 3 in patients over 75 years old
Highly sensitive for AD and rarely seen in normal aging.
- Evaluates hippocampal and entorhinal cortex volume on coronal T1 images at the level of the anterior pons.
- Koedam Score - Posterior Cortical Atrophy
- Rates atrophy in the parietal and precuneus regions. Particularly useful for early-onset or atypical AD such as posterior cortical atrophy syndrome.
- Fazekas Scale - White Matter Lesions
- Grades small vessel ischemic change on T2/FLAIR:
0 = none
1 = punctate foci
2 = early confluent areas
3 = large confluent areas - Fazekas 2-3 suggests clinically significant small vessel disease.
- Mild white matter change is common with normal aging.
- Grades small vessel ischemic change on T2/FLAIR:
- Strategic Infarcts
- Carefully review for small but strategically placed infarcts that can cause disproportionate cognitive effects. Examples:
- Bilateral thalamic infarcts
- Dominant hippocampal infarction
- Anterior cerebral artery infarcts affecting medial frontal lobes
- Posterior cerebral artery infarcts involving the thalamus or hippocampus
Step 4 - Structured Workflow for Reporting
A reproducible reporting sequence ensures consistency:
- Exclude mass lesions or hydrocephalus.
- Assess global cortical atrophy (GCA scale).
- Evaluate medial temporal structures (MTA scale).
- Assess posterior cortical regions (Koedam score).
- Evaluate white matter lesions (Fazekas scale).
- Search for strategic infarcts or focal signal abnormalities.
Following this order allows the radiologist or clinician to generate a structured, checklist-based report that can be compared over time.
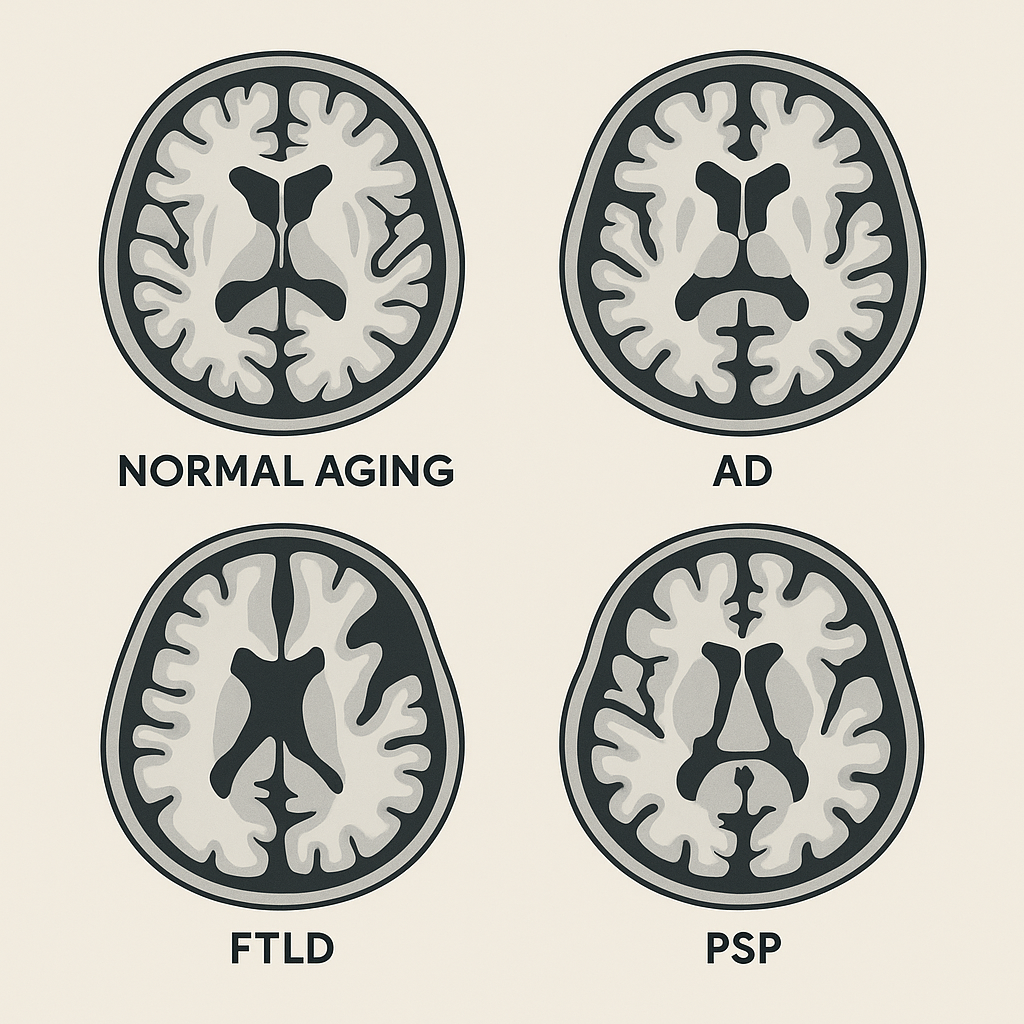
Imaging Features of Major Neurodegenerative Syndromes
Alzheimer's Disease (AD)
- Hallmark: disproportionate medial temporal lobe atrophy (high MTA score).
- Often accompanied by parietal and posterior cingulate-precuneus atrophy.
- Normal hippocampal volumes with cognitive decline make AD less likely.
- FDG-PET: biparietal and posterior cingulate hypometabolism.
- Amyloid PET: detects cortical amyloid deposition.
Frontotemporal Lobar Degeneration (FTLD)
- Includes behavioral variant FTD (bvFTD) and primary progressive aphasias (PPA).
- Focal atrophy of frontal and/or anterior temporal lobes; can be asymmetric.
- bvFTD: bilateral frontal/anterior temporal atrophy.
- Semantic dementia: unilateral anterior temporal atrophy (left > right).
- Hippocampi often spared early, differentiating from AD.
Primary Progressive Aphasia (PPA) Variants
- Semantic variant: left anterior temporal atrophy.
- Nonfluent variant: left frontal operculum and insula atrophy, sometimes involving basal ganglia.
- Logopenic variant: left posterior perisylvian/inferior parietal atrophy, often linked to Alzheimer's pathology.
Dementia with Lewy Bodies (DLB)
- Hippocampal volumes preserved or mildly reduced (low MTA score).
- No consistent focal atrophy pattern.
- Consider in patients with hallucinations, parkinsonism, or REM sleep behavior disorder.
Progressive Supranuclear Palsy (PSP)
- Selective midbrain atrophy greater than pons atrophy.
- Signs: "hummingbird," "Mickey Mouse," "morning glory."
- Quantitative: low midbrain-to-pons ratio or high MRPI.
- FDG-PET: frontal and midbrain hypometabolism.
Multiple System Atrophy (MSA)
- MSA-P: putaminal atrophy with T2 hyperintense rim and hypointensity from iron.
- MSA-C: "hot cross bun" sign in pons; middle cerebellar peduncle and cerebellar atrophy.
- Combination of striatonigral and olivopontocerebellar degeneration supports diagnosis.
Corticobasal Degeneration (CBD)
- Asymmetric cortical atrophy, often parietal and frontal.
- No single pathognomonic sign; clinical correlation essential.
- FDG-PET: asymmetric frontal/parietal hypometabolism.
Conclusion
A systematic MRI review in suspected neurodegenerative disease should always begin with exclusion of treatable causes, then progress through a structured evaluation of global and regional atrophy, hippocampal volume, white matter changes, and strategic infarcts. Integrating standardized scales with pattern recognition for specific syndromes improves diagnostic confidence and consistency. When needed, advanced imaging such as FDG-PET or amyloid PET can further refine the diagnosis and guide management.